
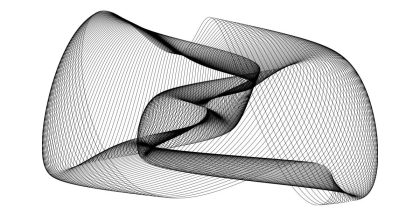
This is a simple harmonograph simulator to generate random-ish harmonographs. It asks for the number of pendulums, and exits if the number is 0. It also asks for the frequency spread, which means roughly, how far from integer may the frequencies go. The nearer to integer they are, the ‘cleaner’ looking the harmonographs are, but they tend to be perhaps less interesting. The further from integer they are, the more they’re likely to look messy.
If you’ve seen harmonograph programs before you might expect there to be an outer loop for stepping through the ‘time’ variable. That’s not necessary here because numpy handles it for us, making the program simpler and much faster. The outer loop here gets user input and generates random parameters for each pendulum’s oscillation (i.e. sine wave): amplitude, frequency, and phase. The one inner loop computes, for each pendulum, the whole x and y vectors, at once. That is, numpy notices that ‘t’ is a vector and so knows to compute x and y using faster code than Python (C).
Each picture is drawn in its own window, which remains on screen until the program exits, or you dismiss it. This way, you can compare several pictures and select the best if you want to keep some. To save a picture, click on the floppy disc icon on the window’s menu bar. Note that the image size depends on the window size you saved it from. To get a bigger picture (or smaller), first adjust the window size.
1 2 3 4 5 6 7 8 9 10 11 12 13 14 15 16 17 18 19 20 21 22 23 24 25 26 27 28 29 30 31 32 33 34 35 36 37 38 39 40 41 42 43 44 45 46 47 48 49 | """ Multi-pendulum random Harmonograph simulator using numpy and matplotlib You can specify any number of pendulums npend > 0; this number also sets the number of frequencies available. The sine wave parameters are a: amplitude, a random float in the range 0 to 1; f: frequency, a random near-integer in the range 1 to npend p: phase, a random float in the range 0 to 2pi Copyright 2017 Alan Richmond @ Python3.codes The MIT License https://opensource.org/licenses/MIT"""import random as rimport matplotlib.pyplot as pltfrom numpy import arange, sin, cos, exp, piplt.rcParams["figure.figsize"] = 8,6 # size of plot in inchesmf = npend = 4 # # of pendulums & maximum frequencysigma = 0.005 # frequency spread (from integer)step = 0.01 # step sizesteps = 40000 # # of stepslinew = 2 # line widthdef xprint(name, value): # convenience function to print params. print(name+' '.join(['%.4f' % x for x in value]))t = arange(steps)*step # time axisd = 1 - arange(steps)/steps # decay vectorwhile True: n = input("Number of pendulums (%d)(0=exit): "%npend) if n != '': npend = int(n) if npend == 0: break n = input("Deviation from integer freq.(%f): "%sigma) if n != '': sigma = float(n) ax = [r.uniform(0, 1) for i in range(npend)] ay = [r.uniform(0, 1) for i in range(npend)] px = [r.uniform(0, 2*pi) for i in range(npend)] py = [r.uniform(0, 2*pi) for i in range(npend)] fx = [r.randint(1, mf) + r.gauss(0, sigma) for i in range(npend)] fy = [r.randint(1, mf) + r.gauss(0, sigma) for i in range(npend)] xprint('ax = ', ax); xprint('fx = ', fx); xprint('px = ', px) xprint('ay = ', ay); xprint('fy = ', fy); xprint('py = ', py) x = y = 0 for i in range(npend): x += d * (ax[i] * sin(t * fx[i] + px[i])) y += d * (ay[i] * sin(t * fy[i] + py[i])) plt.figure(facecolor = 'white') plt.plot(x, y, 'k', linewidth=1.5) plt.axis('off') plt.subplots_adjust(left=0.0, right=1.0, top=1.0, bottom=0.0) plt.show(block=False) |
A GUI version is available on github. It has many more features than this one – check it out!
Hi, I am a graphic designer, this harmonograph looks nice, may I use it in my design?
Sorry for the very late reply! Yes, of course.